Matplotlib 是专门用于开发2D(3D)图表的包
matplotlib.pyplot模块
matplotlib.pytplot包含了一系列类似于matlab的画图函数。
1 | import matplotlib.pyplot as plt |
图形绘制流程
1.创建画布 – plt.figure()
plt.figure(figsize=(), dpi=) figsize:指定图的长宽 dpi:图像的清晰度 返回fig对象plt.plot(x, y)1
2
3
4
2.绘制图像 -- 折线为例
-# 参数一:子图总行数; 参数二:子图总列数; 参数三: 子图位置 # 返回 Axes 实例 # 一行两列的子图 ax = fig.add_subplot(1, 2, 1) ax1 = fig.add_subplot(1,2,2)1
2
3
4
5
6
3.显示图像 -- plt.show()
4.其他
` plt.subplot()` 创建多个画布,画布的排列布局
plt.ion() 和 plt.ioff()
plt.ion(): 使matplotlib的显示模式转换为交互(interactive)模式。即使在脚本中遇到plt.show(),代码还是会继续执行。
plt.ioff():关闭交互模式
如果在脚本中使用ion()命令开启了交互模式,没有使用ioff()关闭的话,则图像会一闪而过,并不会常留。要想防止这种情况,需要在plt.show()之前加上ioff()命令。
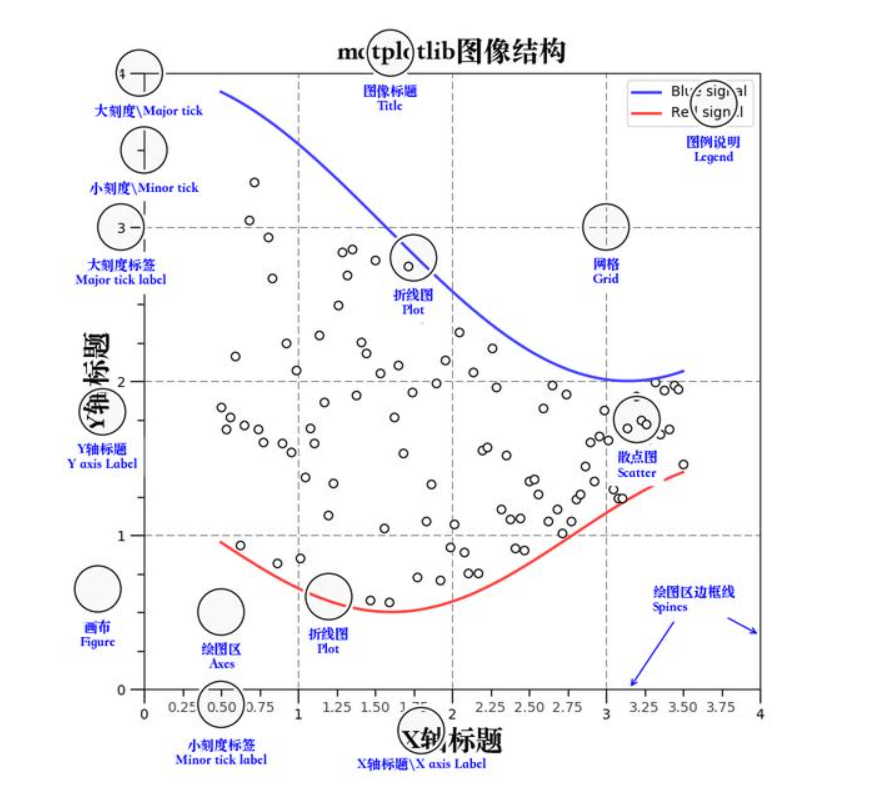
图像结构